Utilizzo l’environment conda py3
Versione moduli installati
1
2
3
4
5
6
7
8
9
10
11
| ~$ pip show Plotly
Name: plotly
Version: 4.8.2
Summary: An open-source, interactive data visualization library for Python
Home-page: https://plotly.com/python/
Author: Chris P
Author-email: chris@plot.ly
License: MIT
Location: /home/user/miniconda3/envs/py3/lib/python3.7/site-packages
Requires: retrying, six
Required-by:
|
1
2
3
4
5
6
7
8
9
10
11
| ~$ pip show Cufflinks
Name: cufflinks
Version: 0.17.3
Summary: Productivity Tools for Plotly + Pandas
Home-page: https://github.com/santosjorge/cufflinks
Author: Jorge Santos
Author-email: santos.jorge@gmail.com
License: MIT
Location: /home/user/miniconda3/envs/py3/lib/python3.7/site-packages
Requires: six, numpy, ipython, ipywidgets, pandas, setuptools, colorlover, plotly
Required-by:
|
Plotly and Cufflinks
Per ottenere i grafici interattivi lanciare il codice in locale.
Non sono riuscito ad esportarli via web con Markdown.
Documentazione Plotly
Documentazione Cufflinks
Documentazione Cufflinks su Technical Analysis (Moving Averages, etc)
1
2
| from plotly.offline import download_plotlyjs, init_notebook_mode, plot, iplot
import cufflinks as cf
|
1
2
| # For Notebooks
init_notebook_mode(connected=True)
|
1
2
| # For offline use
cf.go_offline()
|
Plots
1
2
| df = pd.DataFrame(np.random.randn(100,4),columns='A B C D'.split())
df.head()
|
|
A |
B |
C |
D |
| 0 |
-0.856764 |
-0.678908 |
-0.360994 |
-0.850973 |
| 1 |
0.708704 |
1.740536 |
-0.427867 |
-0.964683 |
| 2 |
-0.165188 |
-0.798954 |
0.756708 |
-0.717790 |
| 3 |
2.211182 |
-1.551565 |
0.315461 |
0.070881 |
| 4 |
1.633826 |
0.205886 |
-1.986120 |
0.017801 |
1
2
| df2 = pd.DataFrame({'Category':['A','B','C'],'Values':[32,43,50]})
df2.head()
|
|
Category |
Values |
| 0 |
A |
32 |
| 1 |
B |
43 |
| 2 |
C |
50 |
1
2
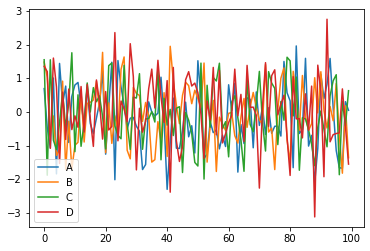
| # matplotlib plot
df.plot()
|
1
| <matplotlib.axes._subplots.AxesSubplot at 0x7f2e014fdbd0>
|
1
2
3
| # iplot plot
df.iplot()
# dopo lo zoom per tornare al size originale basta doppio click
|
1
2
| # scatterplot
df.iplot(kind='scatter',x='A',y='B',mode='markers',size=10)
|
1
2
| # barplot
df2.iplot(kind='bar',x='Category',y='Values')
|
1
2
| # barplot con funzione
df.sum().iplot(kind='bar') # sum(), mean(), count(), etc
|
1
2
| # boxplot
df.iplot(kind='box')
|
1
2
| df3 = pd.DataFrame({'x':[1,2,3,4,5],'y':[10,20,30,20,10],'z':[5,4,3,2,1]})
df3.head()
|
|
x |
y |
z |
| 0 |
1 |
10 |
5 |
| 1 |
2 |
20 |
4 |
| 2 |
3 |
30 |
3 |
| 3 |
4 |
20 |
2 |
| 4 |
5 |
10 |
1 |
1
2
| # 3d surface
df3.iplot(kind='surface',colorscale='rdylbu')
|
1
2
3
| # spread plot
df[['A','B']].iplot(kind='spread')
# non hanno ancora rimosso 'pandas.np' da pandas e va in conflitto con numpy
|
1
2
3
4
5
6
7
| /home/user/miniconda3/envs/py3/lib/python3.7/site-packages/cufflinks/plotlytools.py:849: FutureWarning:
The pandas.np module is deprecated and will be removed from pandas in a future version. Import numpy directly instead
/home/user/miniconda3/envs/py3/lib/python3.7/site-packages/cufflinks/plotlytools.py:850: FutureWarning:
The pandas.np module is deprecated and will be removed from pandas in a future version. Import numpy directly instead
|
1
2
| # histogram
df['A'].iplot(kind='hist',bins=25)
|
1
2
| # multiple histogram
df.iplot(kind='hist',bins=25)
|
1
2
| # bubble plot
df.iplot(kind='bubble',x='A',y='B',size='C')
|
1
2
| # scatter matrix
df.scatter_matrix()
|